1. Understanding Market Dynamics
1.1. Defining trending markets
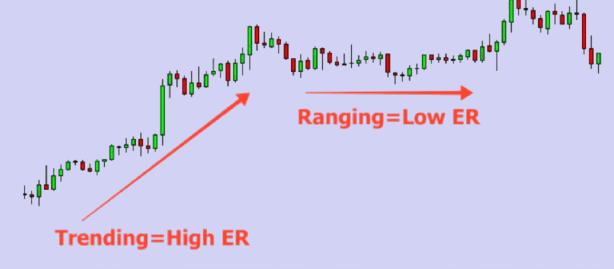
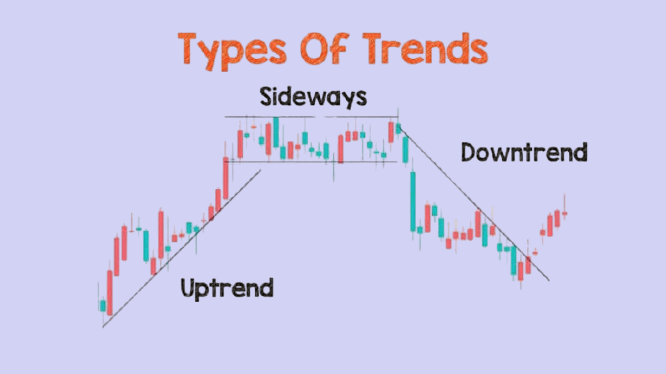
Hey there, fellow trader! Let’s kick things off by talking about trending markets. You know those times when the market seems to be moving in one direction, either up or down? That’s what we call a trending market. It’s like when you’re on a roll, and everything’s going your way – the market just keeps pushing in the same direction.
In a trending market, we see a series of higher highs and higher lows (in an uptrend) or lower lows and lower highs (in a downtrend). It’s like a staircase, always moving in one direction. Pretty neat, right?
1.2. Characteristics of ranging markets
Now, let’s switch gears and chat about ranging markets. These are the times when the market seems to be taking a breather. It’s like when you’re stuck in traffic – lots of back-and-forth movement, but you’re not really getting anywhere.
In a ranging market, prices bounce between a upper and lower boundary, kind of like a ping-pong ball. You’ll see the price hit a ceiling (resistance) and then fall back down to a floor (support), over and over again. It can feel a bit frustrating, but don’t worry – there are ways to make the most of this situation too!
1.3. Factors influencing market behavior
So, what makes the market decide to trend or range? Well, it’s a mix of things. Economic news, political events, company earnings – they all play a part. It’s like the weather – sometimes it’s sunny and clear (trending), and sometimes it’s cloudy and unpredictable (ranging).
Remember, the market is made up of people, and people react to information. When everyone agrees on where things are headed, we often see trends. When there’s uncertainty or disagreement, we tend to see ranging behavior.
2. Identifying Trending Markets
2.1. Key indicators for trend detection
Alright, let’s talk about spotting trends. There are a few trusty tools in our trader’s toolbox for this. Moving averages are a great place to start. If the price is consistently above a moving average, it’s a good sign of an uptrend. If it’s below, we might be in a downtrend.
Another handy tool is the ADX (Average Directional Index). This little gem tells us how strong a trend is. A reading above 25 usually means we’ve got a solid trend on our hands.
2.2. Trend strength analysis
Now, not all trends are created equal. Some are as strong as an ox, while others are as weak as a kitten. To figure out how strong a trend is, we can look at a few things.
First, check out the slope of the trend line. A steeper slope usually means a stronger trend. Also, keep an eye on how the price behaves around the trend line. If it keeps respecting the trend line without breaking through, that’s a good sign of strength.
2.3. Common trend patterns and formations
Trends often form recognizable patterns. It’s like cloud watching – once you know what to look for, you start seeing shapes everywhere!
Some common bullish patterns include the ascending triangle, cup and handle, and the good old flag pattern. For bearish trends, keep an eye out for descending triangles and head and shoulders patterns.
Remember, these patterns aren’t guarantees, but they can give us a heads up about where the market might be headed.
3. Navigating Ranging Markets
3.1. Recognizing range-bound conditions
Spotting a ranging market is all about noticing when the price seems stuck between two levels. It’s like watching a tennis match – the ball keeps going back and forth over the net.
One way to confirm a range is by using the ADX we talked about earlier. If it’s below 25, chances are we’re in a range. Also, if you see the price bouncing between two levels multiple times, that’s a pretty good sign of a range.
3.2. Support and resistance levels in ranging markets
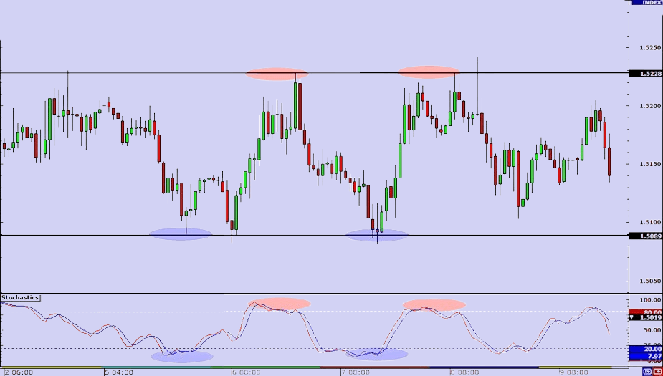
In a ranging market, support and resistance levels are your best friends. Support is like the floor – it’s where the price tends to stop falling and bounce back up. Resistance is like the ceiling – it’s where the price usually stops rising and falls back down.
To find these levels, look for areas where the price has reversed multiple times. The more times the price has bounced off a level, the stronger it is. It’s like the market has a memory of these prices!
3.3. Strategies for trading within a range
Trading in a range can be tricky, but there are ways to make it work for you. One popular strategy is to buy near support and sell near resistance. It’s like buying low and selling high, but within a smaller price range.
Another approach is to use oscillators like the RSI or Stochastic. These tools can help you spot when the price might be ready to reverse within the range.
Just remember, ranges can break at any time, so always be prepared for a breakout!
4. Technical Analysis Tools for Market Assessment
4.1. Moving averages and trend lines
Moving averages are like the Swiss Army knife of technical analysis – they’re simple but super useful. They smooth out price action and can help you see the overall direction of the market.
Trend lines are another great tool. By connecting the highs or lows of a price movement, you can visualize the trend direction. It’s like drawing a line in the sand – as long as the price stays on the right side of that line, the trend is likely to continue.
4.2. Oscillators and momentum indicators
Oscillators are fantastic for ranging markets. Tools like the RSI (Relative Strength Index) or Stochastic oscillator can help you spot potential reversals. They’re like a speedometer for the market – they show you when things might be moving too fast and due for a pullback.
Momentum indicators, like the MACD (Moving Average Convergence Divergence), can help you gauge the strength of a trend. They’re like a fitness tracker for the market – they show you how much energy the trend has left.
4.3. Volume analysis in trending and ranging markets
Don’t forget about volume! It’s like the heartbeat of the market. In a trending market, you want to see volume increasing as the price moves in the trend direction. It’s like a crowd getting more and more excited at a concert.
In a ranging market, volume can help you spot potential breakouts. If you see a sudden spike in volume as the price approaches a range boundary, it might be getting ready to break out. It’s like water pressure building up behind a dam – eventually, something’s got to give!
5. Risk Management in Different Market Conditions
5.1. Setting stop-loss orders in trending markets
In trending markets, it’s often a good idea to use trailing stop-losses. These move with the market, letting your profits run while protecting you from sudden reversals. It’s like having a safety net that moves with you as you climb higher.
A common approach is to set your stop-loss just below a recent swing low in an uptrend, or above a recent swing high in a downtrend. This way, you’re giving the trend room to breathe while still protecting your downside.
5.2. Managing risk in ranging markets
In ranging markets, risk management is all about respecting those support and resistance levels we talked about earlier. You might set your stop-loss just beyond the opposite side of the range from your entry.
For example, if you’re buying near support, you might set your stop-loss just below that support level. If support breaks, it could mean the range is breaking down, and you’d want to get out quickly.
5.3. Position sizing strategies for each market type
Position sizing is crucial in both trending and ranging markets. In a strong trend, you might feel comfortable taking larger positions, but remember – the stronger the trend, the more likely a reversal becomes.
In ranging markets, smaller position sizes often make sense. The potential profit is usually smaller in a range, so you want to make sure your risk matches that potential reward.
A good rule of thumb is to never risk more than 1-2% of your account on any single trade. It’s like not putting all your eggs in one basket – it helps you stay in the game even if a few trades don’t go your way.
6. Psychological Aspects of Trading in Trending and Ranging Markets
6.1. Emotional challenges in trending markets
Trending markets can be exciting, but they come with their own emotional challenges. Fear of missing out (FOMO) can lead to jumping into a trend too late. On the flip side, fear of losing profits can make you exit too early.
The key is to have a plan and stick to it. Set your entry and exit points before you trade, and try to follow them without letting emotions take over. It’s like having a map on a road trip – it helps you stay on course even when the journey gets bumpy.
6.2. Patience and discipline in ranging markets
Ranging markets test your patience like nothing else. It can be tempting to overtrade, trying to catch every little move within the range. But remember, the best trades often come from waiting for the price to reach those key support and resistance levels.
Discipline is crucial here. Stick to your strategy, wait for your setups, and don’t force trades out of boredom. It’s like fishing – sometimes the best thing you can do is wait patiently for the fish to come to you.
6.3. Developing a mindset for adaptability
Perhaps the most important psychological skill for any trader is adaptability. Markets can switch between trending and ranging conditions quickly, and you need to be ready to adjust your approach.
Stay flexible in your thinking, and always be ready to reassess your view of the market. It’s like being a chameleon – the ability to adapt to your environment is key to survival (and success) in the trading world.
Summary
We’ve covered a lot of ground here! From understanding the difference between trending and ranging markets to exploring strategies for each, and even diving into the psychological aspects of trading. Remember, whether the market is trending or ranging, there are always opportunities – it’s all about having the right tools, strategies, and mindset to tackle whatever the market throws your way.
FAQs
What is the main difference between trending and ranging markets?
The main difference is in price movement. Trending markets show consistent price movement in one direction (up or down), while ranging markets move back and forth between levels of support and resistance without a clear directional bias.
How can I determine if a market is trending or ranging?
You can use tools like moving averages, trend lines, and the ADX indicator. In a trend, prices will consistently make higher highs and higher lows (or lower lows and lower highs), while in a range, prices will bounce between defined levels of support and resistance.
Which trading strategies work best in trending markets?
Trend-following strategies often work well in trending markets. These might include using moving averages for entries, trailing stop-losses to protect profits, and looking for pullbacks as potential entry points.
Are there specific indicators that perform better in ranging markets?
Oscillators like RSI and Stochastic often perform well in ranging markets. These indicators can help identify overbought and oversold conditions, which can be useful for finding potential reversal points within the range.
How often do markets switch between trending and ranging conditions?
Markets can switch between trending and ranging conditions at any time, and the frequency can vary greatly depending on the specific market and timeframe you’re looking at. It’s important to regularly reassess market conditions and be prepared to adapt your strategy as needed.