1. Introduction to Trend Lines
1.1. Definition and purpose of trend lines
Trend lines analysis are like your trusty compass in the world of trading. They’re simple lines we draw on charts to help us see which way the market is moving. Think of them as connecting the dots between price points to show us the overall direction.
1.2. Types of trends: uptrend, downtrend, and sideways
Just like life, markets have their ups and downs. An uptrend is when prices are generally climbing higher – it’s the sunny days of trading. A downtrend is when prices are falling – the rainy days, if you will. And sometimes, prices just can’t make up their mind and move sideways – that’s like those cloudy days where the weather could go either way.
1.3. Importance of trend lines in technical analysis
Trend lines are super important in technical analysis. They help us figure out where the market might be heading next. It’s like having a crystal ball, but based on actual data. They can show us potential support and resistance levels, and even give us hints about when a trend might be changing.
2. Drawing Trend Lines Correctly
2.1. Identifying key highs and lows
To draw good trend lines, we need to spot the important highs and lows on our chart. It’s a bit like playing connect the dots, but we’re only interested in the most significant points. These are usually the peaks and valleys that stand out when you look at the chart.
2.2. Connecting points to create a trend line
Once we’ve found our key points, we simply draw a line connecting them. For an uptrend, we connect the low points. For a downtrend, we connect the high points. It’s pretty straightforward, but it takes some practice to get it just right.
2.3. Adjusting and refining trend lines over time
Markets are always changing, so our trend lines need to change too. As new price data comes in, we might need to tweak our lines a bit. It’s like adjusting your route on a road trip – you might need to make some changes as you go along.
3. Understanding Trend Line Breaks
3.1. Recognizing valid trend line breakouts
A trend line break is when the price moves through our trend line. It’s exciting because it could mean the trend is changing. But we need to be sure it’s a real break, not just a false alarm. We usually look for a decisive move through the line, not just a tiny peek above or below it.
3.2. False breakouts and how to avoid them
False breakouts are the pranksters of the trading world. They trick us into thinking the trend has changed when it really hasn’t. To avoid falling for these tricks, we often wait for confirmation. This might mean waiting to see if the price stays beyond the trend line for a while, or looking for other signs that support the breakout.
3.3. Using confirmation indicators with trend line breaks
To be extra sure about a trend line break, we can use other indicators to back up what we’re seeing. This might be volume indicators, momentum oscillators, or other technical tools. It’s like getting a second opinion before making a big decision.
4. Trend Line Trading Strategies
4.1. Entering trades at trend line bounces
One way to use trend lines is to enter trades when the price bounces off the line. In an uptrend, we might buy when the price touches the trend line and starts to move up again. It’s like jumping on a train that’s already moving – we’re joining the trend that’s already in place.
4.2. Trading trend line breakouts
Another strategy is to trade when the price breaks through a trend line. This can signal a potential reversal or the start of a new trend. It’s a bit riskier, but it can lead to big gains if we’re right. It’s like being the first to spot a new fashion trend – if we’re right, we can ride the wave from the beginning.
4.3. Combining trend lines with other technical indicators
Trend lines work great on their own, but they’re even better when combined with other tools. We might use moving averages, RSI, or other indicators to give us more confidence in our trend line analysis. It’s like using multiple weather forecasts to decide if you need an umbrella – the more information we have, the better our decision.
5. Managing Risk with Trend Lines
5.1. Setting stop-loss orders using trend lines
Trend lines can be great for setting stop-loss orders. We might place our stop just beyond the trend line, so if the price breaks through, we exit the trade. It’s like having an emergency exit plan – we know exactly when to get out if things don’t go our way.
5.2. Determining profit targets based on trend line analysis
We can also use trend lines to set profit targets. One way is to look at the distance between parallel trend lines in a trend channel. This can give us an idea of how far the price might move. It’s like estimating how far we can drive on a tank of gas – it gives us a reasonable target to aim for.
5.3. Adjusting position sizes according to trend strength
The strength of a trend can help us decide how much to invest. A strong, well-established trend might give us confidence to take a larger position. A weaker or newer trend might suggest we should be more cautious. It’s like deciding how many layers to wear based on how cold it is outside – we adjust based on the conditions.
6. Advanced Trend Line Techniques
6.1. Multiple time frame trend line analysis
Looking at trend lines on different time frames can give us a more complete picture. We might see an uptrend on a daily chart but a downtrend on a weekly chart. This can help us make more informed decisions. It’s like looking at a map from different zoom levels – we get both the big picture and the details.
6.2. Using trend channels for enhanced precision
Trend channels are like trend lines, but we draw two parallel lines instead of one. The price tends to bounce between these lines. This can give us more precise entry and exit points. It’s like having guardrails on a road – we know the boundaries of where the price is likely to go.
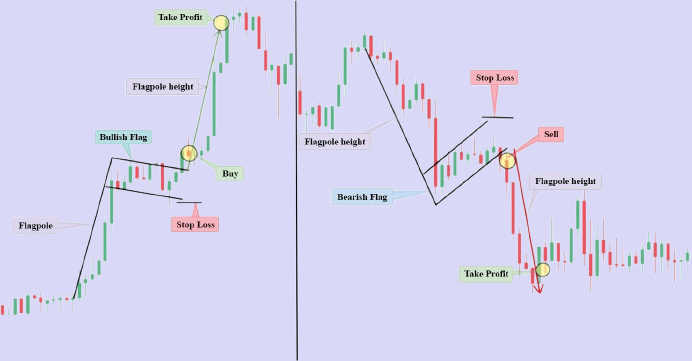
6.3. Incorporating trend lines in chart patterns
Trend lines are often part of larger chart patterns like triangles, wedges, or flags. Understanding how trend lines fit into these patterns can give us even more insight into potential market moves. It’s like recognizing familiar shapes in the clouds – once you know what to look for, you start seeing patterns everywhere.
7. Common Mistakes in Trend Line Analysis
7.1. Over-relying on trend lines
While trend lines are great, they’re not magic. Relying too much on them can lead us astray. We need to remember that they’re just one tool in our trading toolbox. It’s like trying to build a house with just a hammer – you need other tools too.
7.2. Ignoring fundamental factors
Technical analysis is powerful, but we can’t forget about fundamental factors. Things like economic news, company earnings, or global events can all impact prices. It’s like trying to predict the weather without considering the season – we need to look at the bigger picture too.
7.3. Failing to adapt to changing market conditions
Markets are always changing, and our analysis needs to change with them. Sticking to old trend lines when the market has clearly shifted can lead to losses. We need to be flexible and ready to redraw our lines when necessary. It’s like updating your wardrobe as fashions change – we need to keep up with the times.
8. Summary: Key Takeaways for Effective Trend Line Analysis
Trend line analysis is a powerful tool in any trader’s kit. Remember to draw your lines carefully, connecting significant highs or lows. Be aware of breakouts, but always seek confirmation. Use trend lines for both entry signals and risk management. Don’t forget to combine them with other indicators and always keep an eye on the broader market context. With practice and patience, trend lines can become one of your most valuable trading allies.
9. Frequently Asked Questions
9.1. How often should I redraw trend lines?
There’s no hard and fast rule, but generally, you should redraw your trend lines whenever significant new highs or lows form that don’t fit your current lines. It’s a bit like updating your route on a GPS – you do it when you need to, not on a fixed schedule.
9.2. Can trend lines be used in all markets and timeframes?
Yes, trend lines can be useful in pretty much any market and any timeframe. However, they tend to be more reliable in markets with higher liquidity and on longer timeframes. It’s like how a boat’s direction is easier to see in a wide river than in a small, choppy stream.
9.3. What’s the difference between trend lines and support/resistance levels?
Trend lines and support/resistance levels are similar, but trend lines are always sloping, while support and resistance levels are typically horizontal. Trend lines show the direction of the trend, while support and resistance show price levels where the market has paused or reversed in the past.
9.4. How many touch points are needed for a valid trend line?
Most traders look for at least two touch points to draw a trend line, but three or more touches make the line more reliable. It’s like making friends – the more times you’ve met, the more confident you can be in the relationship.
9.5. Are trend lines more effective in certain market conditions?
Trend lines tend to work best in trending markets (surprise, surprise!). They can be less effective in very choppy or sideways markets. It’s like trying to use a compass in a very small area – it’s more useful when you’re actually going somewhere.