1. Understanding the Basics of Candlestick Patterns
1.1. What are candlestick patterns?
Candlestick patterns are visual representations of price movements in financial markets. They show the opening, closing, high, and low prices for a specific time period. These patterns can help traders spot potential trends and make informed decisions.
1.2. The history and origins of candlestick charting
Candlestick charting has a rich history dating back to 18th century Japan. A rice trader named Munehisa Homma developed this technique to track price movements in the rice markets. It’s amazing to think that a method created centuries ago is still widely used today!
1.3. Why candlestick patterns are important for traders
Candlestick patterns are like a secret language of the markets. They can help you:
- Identify potential trend reversals
- Spot market sentiment
- Make more informed trading decisions
I remember when I first started trading, candlestick patterns seemed like hieroglyphics to me. But once I got the hang of them, it was like putting on a pair of glasses and seeing the market clearly for the first time.
2. Essential Components of a Candlestick
2.1. The body: Open and close prices
The body of a candlestick represents the difference between the opening and closing prices. It’s like the heart of the candlestick, telling you the overall direction of price movement during that period.
2.2. The wick: High and low prices
The wicks, or shadows, show the highest and lowest prices reached during the period. I like to think of them as the candlestick’s arms, reaching out to test the market’s limits.
2.3. Color coding: Bullish vs. bearish candles
Typically, green or white candles indicate bullish movement (prices closed higher than they opened), while red or black candles show bearish movement (prices closed lower than they opened). It’s like a quick visual cue for market sentiment.
3. Common Candlestick Patterns Every Trader Should Know
3.1. Single candlestick patterns
Some popular single candlestick patterns include:
- Doji: Shows indecision in the market
- Hammer: Potential bullish reversal
- Shooting Star: Potential bearish reversal
3.2. Double candlestick patterns
Double candlestick patterns to look out for:
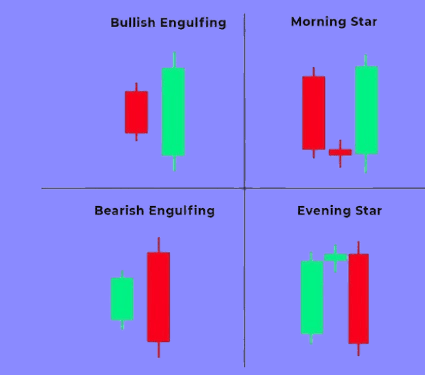
- Engulfing patterns: Bullish or bearish
- Harami: Potential trend reversal
- Tweezer tops and bottoms: Possible trend reversal
3.3. Triple candlestick patterns
Some triple candlestick patterns include:
- Morning Star: Bullish reversal pattern
- Evening Star: Bearish reversal pattern
- Three White Soldiers: Strong bullish trend
4. Interpreting Candlestick Patterns in Context
4.1. Considering market trends
It’s important to look at candlestick patterns within the bigger picture of market trends. A pattern that suggests a bullish reversal might not be as reliable if it occurs in a strong downtrend.
4.2. Volume analysis alongside candlestick patterns
Volume can add weight to what the candlesticks are telling you. High volume often confirms the strength of a pattern.
4.3. Timeframe considerations
Patterns on different timeframes can tell different stories. What looks like a reversal on a 5-minute chart might just be a blip on a daily chart.
5. Practical Techniques for Improving Pattern Recognition
5.1. Regular chart analysis practice
Like any skill, recognizing candlestick patterns gets easier with practice. Try to spend some time each day looking at charts and identifying patterns.
5.2. Using pattern recognition software
There are many tools out there that can help you spot patterns. But remember, these should complement your skills, not replace them.
5.3. Keeping a trading journal
I’ve found keeping a trading journal incredibly helpful. It allows you to track the patterns you’ve spotted and see how they played out.
6. Advanced Candlestick Pattern Strategies
6.1. Combining patterns with technical indicators
Combining candlestick patterns with other technical indicators like moving averages or RSI can give you a more complete picture of market conditions.
6.2. Pattern confirmation techniques
Waiting for confirmation of a pattern can help reduce false signals. For example, you might wait for a break of a key level following a reversal pattern.
6.3. Risk management when trading based on patterns
No pattern is foolproof, so always use proper risk management. Set stop losses and don’t risk more than you can afford to lose on any single trade.
7. Common Mistakes to Avoid in Candlestick Pattern Analysis
7.1. Overreliance on single patterns
Don’t put too much faith in a single pattern. The market is complex, and it’s rare for one pattern to tell the whole story.
7.2. Ignoring the broader market context
Always consider the bigger picture. A bullish pattern might not mean much if the overall market is in a strong downtrend.
7.3. Failing to consider other forms of analysis
Candlestick patterns are just one tool in your trading toolkit. Don’t forget about fundamental analysis, market sentiment, and other technical indicators.
Summary
Improving your candlestick pattern recognition skills takes time and practice, but it’s a valuable skill for any trader. Remember to always consider patterns in context, practice regularly, and use them as part of a comprehensive trading strategy.
Frequently Asked Questions
How long does it take to become proficient in candlestick pattern recognition?
It varies for everyone, but with regular practice, you can start recognizing common patterns within a few weeks to a month. Mastery, however, can take months or even years of consistent study and application.
Are candlestick patterns reliable in all market conditions?
While candlestick patterns can be useful in many situations, their reliability can vary depending on market conditions. They tend to be more reliable in trending markets and less so in choppy or sideways markets.
What are the best resources for learning more about candlestick patterns?
There are many great books, online courses, and websites dedicated to candlestick patterns. Some popular books include “Japanese Candlestick Charting Techniques” by Steve Nison and “The Candlestick Course” by Steve Nison.
How can I practice candlestick pattern recognition without risking real money?
Many brokers offer demo accounts where you can practice trading with virtual money. You can also use free charting websites to analyze historical data and practice identifying patterns without making actual trades.
Are there any specific candlestick patterns that are more reliable than others?
While reliability can vary, some patterns like engulfing patterns, doji, and hammer/hanging man tend to be widely recognized and respected. However, it’s important to remember that no pattern is 100% reliable, and they should always be used in conjunction with other forms of analysis.